The COVID-19 pandemic has resulted in significant changes in the volume and types of calls received by telephone triage nurses. In this article we share an analysis of how those changes have impacted ClearTriage users in order to provide insights we hope will be helpful to triage nurses and nurse managers everywhere.
Overall Call Volume by Week
The graph below shows the change in call volume by week of our US-based customers. The left axis provides a comparison to the average volume of calls in February (there wasn’t a significant variation in call volume per week during that month). Notice the rapid rise in the number of calls starting in the second week in March, with the highest number of calls occurring in the third week of March (March 16-22). And perhaps more interestingly, that peak is followed by a decrease in the number of calls the following weeks, returning to the February average by early April.
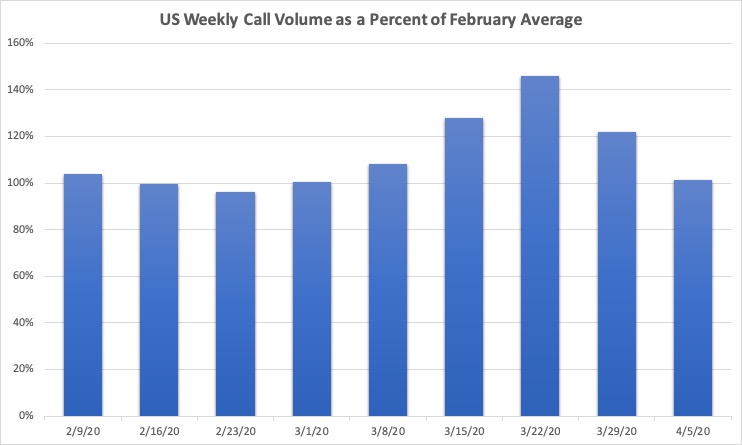
The surge in calls during the middle of March corresponds with implementation of shelter-in-place recommendations and regulations across the US and the cancellation of most non-essential medical visits. And while this chart does not include data from organizations that started using ClearTriage after February 2nd, some of our existing customers created COVID-19 hotlines during March that changed their call volumes. Finally, there are also anecdotal reports of the “worried well” increasing volume on triage lines during this time.
Overall Call Volume by Week in New York and Washington
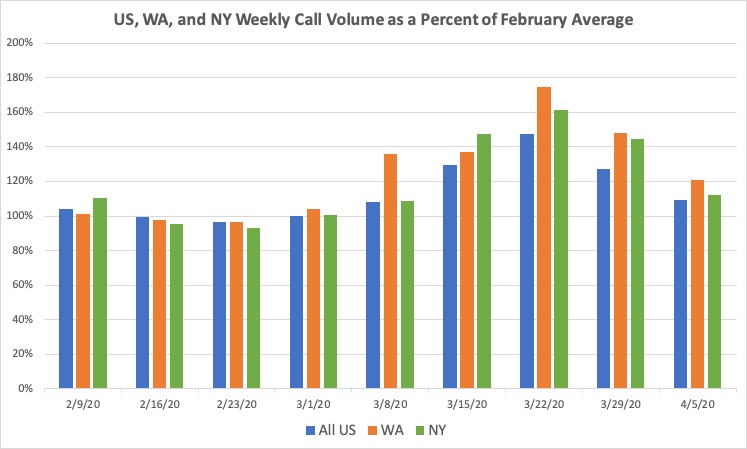
What about locations with a high incidence of COVID-19 cases? The chart below adds data for the states of Washington and New York. The week ending March 22nd remains the highest volume week for all locations and overall the curve is similar between the locations. Washington started the higher volume a week earlier, and both states have a higher percentage growth than the national average, but it’s not a huge percentage more.
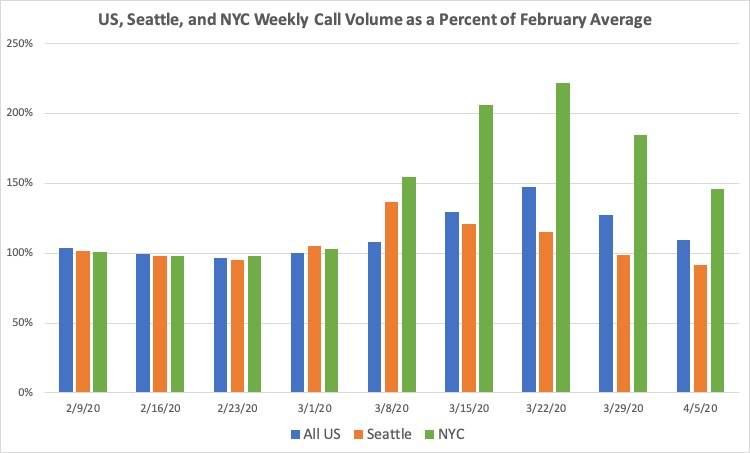
But digging in a little deeper, here’s the same graph with just customers from the Seattle and New York City metro areas. The Seattle data has greater statistical significance than the NYC data (it is based on almost 4x more calls taken by almost 2x the number of organizations), but the NYC data certainly shows the huge increase in calls that is possible during the peak of the pandemic in a city.
Preparing as a Triage Nurse or Nurse Manager
While we hope New York City recovers quickly and that no other city in the US is hit as hard, as a nurse manager it makes sense to have a plan to handle a potential surge in calls. Just in case. You have three ways you could accommodate the increase in volume:
- More hours from the same staff. Use your same triage staff, but have them work longer shifts or more shifts per week.
- Add additional staff. While triage calls are best handled by a registered nurse or provider, can other staff help in an emergency? LPNs/LVNs? MAs? This certainly isn’t ideal, but it’s better than not answering the calls. Or is there another source of RNs who could help you handle triage calls? This after hours nurse triage services list may help you identify a resource that will let you contract out some of your calls during the peak.
- Reduce the time per call. Change expectations for your nurses as to how detailed their assessment is or how much care advice they give. Change the amount of documentation recorded per call. Yes, these suggestions wouldn’t make sense in normal times. But you need to plan for the worst case and be ready to make those changes smoothly if necessary. Hopefully they won’t be.
When handling a high volume of calls, use of established protocols will also be key to safely and quickly handling those calls. It might be tempting to think that if all you’re doing is triaging the same type of call over and over again, then reading through the same protocol each time is not necessary. But the exact opposite is true; studies show that humans are more prone to skipping steps when performing highly repetitive tasks than they are when performing novel tasks. Protocols act as checklists to ensure that important steps are not missed.
And these protocols will be even more important if you’re using staff who don’t typically take telephone triage calls. Protocols can be used in software like ClearTriage, including our free COVID-19 only version. Or you can use PDFs.
Now back to the data…
COVID-19 Related Call Volume by Week
Let’s look at the change in call volume by week, but only for calls relating to COVID-19. (We did this analysis with calls using the COVID-19 protocols as well as the Fever, Cough, and Breathing Difficulty protocols.)
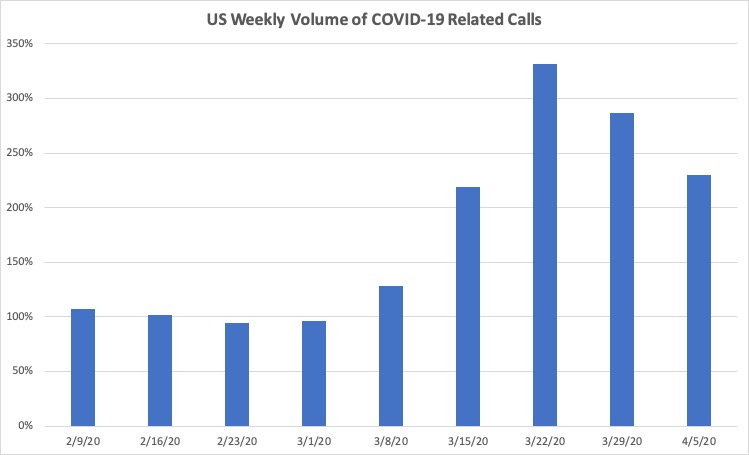
When compared to the overall call volume, the peak week is the same, but the increase is dramatically more – 330% as opposed to 145%. And even though subsequent weeks show a decline just like the overall call volume chart, the first week in April is still 230% of the February level of COVID-19 calls.
It’s interesting contrasting the growth in COVID-19 nurse triage calls to the changes in non-COVID-19 calls (calls using any protocol other than the ones listed above).
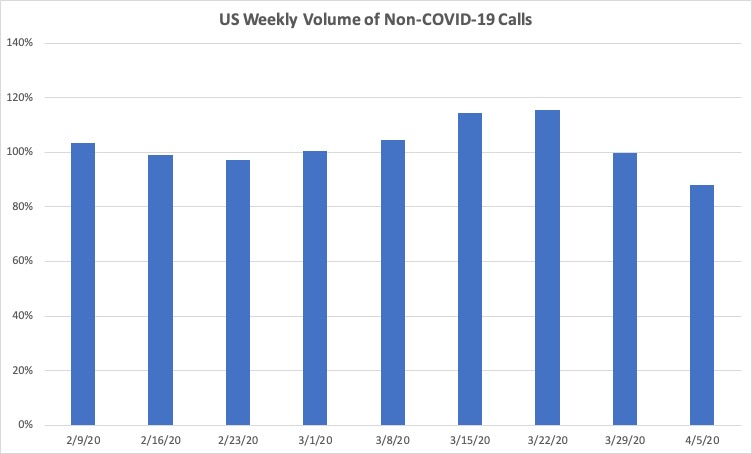
Note how the first week in April has only 88% of the February volume of calls for all other symptoms. That reduction of calls is why the overall call volume for that week is only 2% higher than February even though the COVID-19 call volume is significantly higher.
Types of COVID-19 Calls
In early February we released the first Schmitt-Thompson Coronavirus triage protocol (the virus wasn’t even named COVID-19 yet). As appropriate for that time, this protocol focused on assessing whether the patient had been in close contact with a person diagnosed with the novel Coronavirus or had travelled to a CDC-identified high-risk area (the news was just starting to talk about locations other than China).
After updating that protocol in early March, at the end of March we released the second of the Schmitt-Thompson COVID-19 protocols. This COVID-19 – Diagnosed or Suspected protocol was meant for callers that had been previously diagnosed and even more importantly, callers in areas with a high community transmission rate such that all callers with fever or cough are suspected to have COVID-19 and are told to stay at home unless their symptoms are severe. The emphasis in these areas is on reducing spread rather than testing and identifying people with COVID-19. The first COVID-19 – Exposure protocol was relegated to locations with low community transmission rates that are still tracking individual cases and their community interactions.
While the two different protocols have only been available for a short time, the relative usage of the two protocols provides insight into how the country as a whole is handling COVID-19 calls.
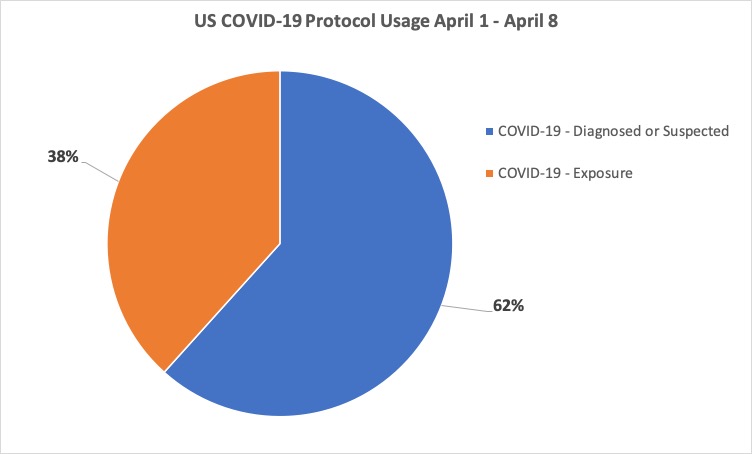
Since the COVID-19 Diagnosed or Suspected was released, it has been used in 62% of the calls using one of the two versions of these protocols. That is a telling statistic showing how much of the country is no longer trying to identify COVID-19 cases based on travel or contact, but instead is just trying to minimize transmission and flatten the curve.
Summary
The COVID-19 pandemic has changed the volume and types of calls handled by triage nurses around the country. We see an increase in overall call volume peaking in mid-March. That pattern is similar in high transmission areas, but more pronounced in Washington and especially New York City. It appears that non-COVID-19 triage calls are decreasing, helping triage lines handle the increase in calls due to the novel Coronavirus. And almost 2/3 of the country is managing fevers and coughs by telling the callers to stay home rather than sending them for testing.
We hope this helps your understanding of potential changes in call volume, and your “what if” planning. Telephone triage protocols are an important complement to a nurse’s judgment in safely triaging a patient over the phone. And even more important when calls are taken rapidly or by staff who don’t usually take triage calls.
